Q4 2025 | U.S. Office Market Report
- Jan 15
- 5 min read
Updated: Mar 30

Key OFFICE Takeaways For Q4 2025
The tide is turning as office demand turned positive in the second half of 2025. National net absorption hit +2.5 million square feet (msf) in the final six months of the year, and full-year demand was positive in over half of U.S. office markets.
Leading indicators point to vacancy peaking later this year. Overall vacancy was up only 5 basis points (bps) quarter-over-quarter (QOQ) at 20.5%, and the annualized increase of 30 bps was the smallest such increase since 2020. Sublease space continues to get leased up, with availabilities declining by 20% since the beginning of 2024.
Occupiers are turning to creative strategies to find the right type of space. While overall vacancy remains historically high, not all office space is created equal. Class A demand has been positive for the past year, and demand is moving down the quality spectrum. New construction starts are not materializing as the pipeline has hit 25+ year lows. Competition for quality office space is growing.
Office Demand is Building Momentum:
Office market fundamentals began to improve in early 2024, when sublease inventories and vacancy increases peaked. By the second half of 2025, these positive signs had solidified into a clear recovery. Net absorption turned positive in the final six months of 2025 (+2.5 msf), marking the strongest back-to-back quarterly performance since COVID, aside from the brief rebound in early 2021. Higher-quality buildings drew even more attention, with Class A absorption near +3.5 msf in Q4 2025 and topping +9.2 msf for the full year.
After 12 straight quarters of negative absorption, U.S. demand has been positive for the past two quarters. While full-year net absorption in 2025 remained negative, at -6.7 msf, this represents a substantial improvement from the prior five-year average of -50.5 msf annually. Moreover, the weakness remained highly concentrated. Excluding the five markets that were the weakest, 2025 net absorption for the remaining 86 U.S. office markets tracked by Cushman & Wakefield Research would have been +11.1 msf.
Demand for office space appears to be growing, and it is also spreading geographically. Absorption was positive for the year in 50 U.S. office markets. That is up from 33 markets in 2024 and is the highest number of markets with positive absorption for a full year since 2019. There were seven markets with over 1 msf of positive absorption in 2025, led by Midtown Manhattan (+6.1 msf), San Jose (+3.1 msf), Dallas (+2.2 msf), Northern New Jersey (+1.6 msf), Cleveland (+1.3 msf), Midtown South Manhattan (+1.3 msf), and Austin (+1.1 msf). Another third of U.S. markets had positive absorption exceeding 100,000 sf in 2025.
In further signs of a spreading recovery, there are another 14 markets where demand was negative for the full year but turned positive in Q4 2025. This includes Boston, Denver, Detroit, Orange County, Puget Sound – Eastside, and Suburban Maryland.
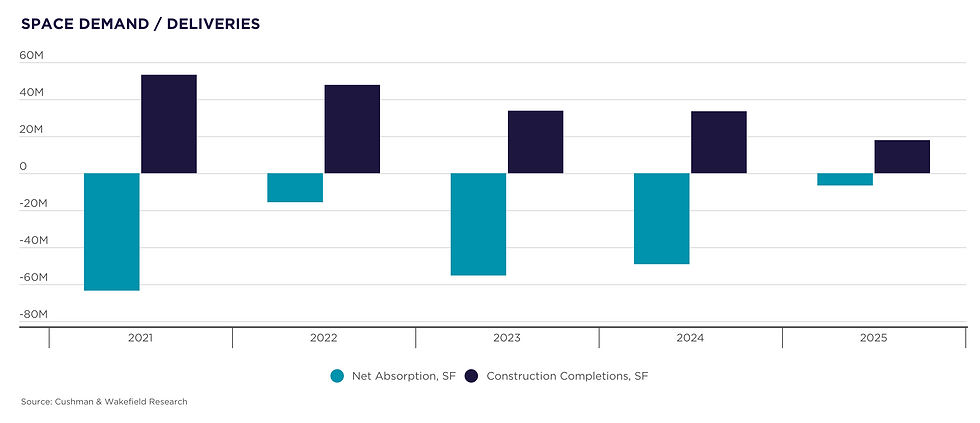
Space Demand Deliveries:
Vacancy Stabilizing:
In Q4 2025, 4 msf of new office space was delivered across the U.S. This is the lowest quarterly total since 2012. Improving demand and muted new construction meant that vacancy remained essentially flat QOQ, up just 5 bps. Vacancy in Class A buildings declined by 5 bps QOQ.
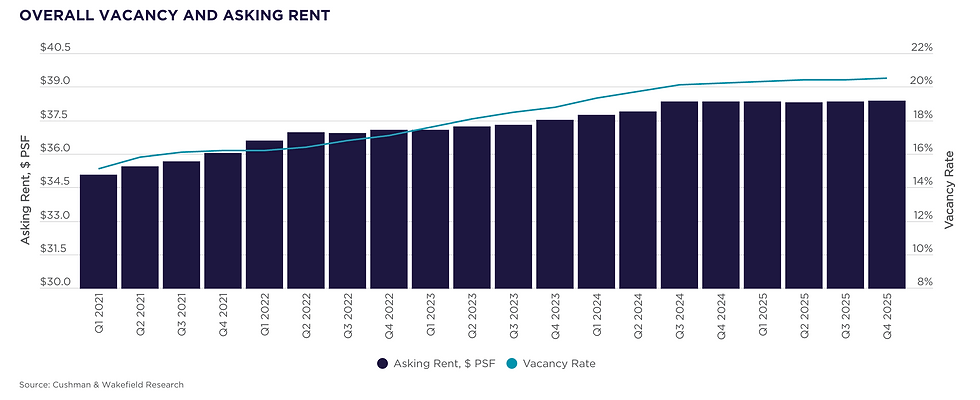
The overall national vacancy rate finished the year at 20.5%, up 30 bps from Q4 2024. This is the smallest year-over-year (YOY) increase in five-and-a-half years. Vacancy declined over the past 12 months in half of U.S. markets, and declines exceeded 100 bps in 17 different markets, including Kansas City, Northern New Jersey, Midtown Manhattan, Phoenix, Salt Lake City, San Jose, and Tampa.
The decline in vacant sublease availabilities is a large driver of firming occupancies. At 108.6 msf, the national inventory of sublease space is down 20% from its Q1 2024 peak. In 2025, sublease availabilities declined by 17.5 msf (a decrease of 14% YOY), and this strengthening was widespread with YOY declines occurring in over 60% of U.S. markets. Sublease availability drops exceeded 100,000 sf in three gateway markets—Manhattan (-3.8 msf), San Francisco (-1.5 msf), and Los Angeles (-112,000 sf)—as well as across a number of other noteworthy office markets such as San Jose (-2.8 msf), Dallas (-1.7 msf), Phoenix (-1.0 msf), Atlanta (-880,000 sf), Austin (-801,000 sf), Denver (-761,000 sf), Central New Jersey (-544,000 sf), Northern New Jersey (-419,000 sf), and Minneapolis (-319,000 sf).
Construction activity remains subdued as the amount of U.S. office space under construction dropped below 20 msf for the first time in the 21st century. The pipeline declined by 35% in 2025 and is now just 15% as large as it was when it peaked at 136 msf in Q1 2020. Total office inventory has in fact dropped by 20.7 msf over the past six quarters as demolitions and conversions have begun to outpace new construction deliveries.
Overall Vacancy and Asking Rent:


MarketBeat:
U.S. Q4 2025
Demand Indicators Q4 2025

key lease transactions
Vacancy Rates Q4 2025

Key Sales Q4 2025
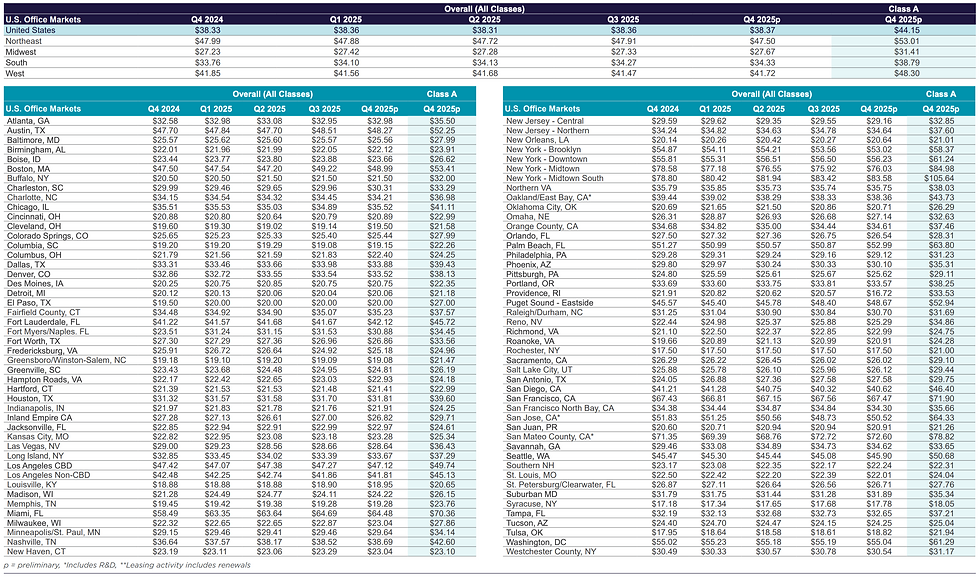
Asking Rents Q4 2025
Inventory Q4 2025

Methodology:
Cushman & Wakefield’s quarterly estimates are derived from a variety of data sources, including its own proprietary database, and historical data from third party data sources. The market statistics are calculated from a base building inventory made up of office properties deemed to be competitive in the local office markets. Generally, owner-occupied and federally-owned buildings are not included. Single tenant buildings and privately-owned buildings in which the federal government leases space are included. Older buildings unfit for occupancy or ones that require substantial renovation before tenancy are generally not included in the competitive inventory. The inventory is subject to revisions due to resampling. Vacant space is defined as space that is available immediately or imminently after the end of the quarter. Sublet space still occupied by the tenant is not counted as available space. The figures provided for the current quarter are preliminary, and all information contained in the report is subject to correction of errors and revisions based on additional data received.
Explanation of Terms:
Total Inventory:
The total amount of office space (in buildings of a predetermined size by market) that can be rented by a third party.
Overall Vacancy Rate:
The amount of unoccupied space (new, relet, and sublet) expressed as a percentage of total inventory.
Direct Vacancy Rate:
The amount of unoccupied space available directly through the landlord, excludes sublease space.
Absorption:
The net change in occupied space between two points in time. (Total occupied space in the present quarter minus total occupied space from the previous quarter, quoted on a net, not gross, basis.)
Leasing Activity:
The sum of all leases over a period of time. This includes pre-leasing activity as well as expansions. It does include renewals.
Overall Weighted Asking Rents:
Gross average asking rents weighted by the amount of available direct and sublease space in Class A, B and C properties.
Class A Asking Rents: Gross average asking rents weighted by the amount of available Class A direct and sublease space.
Regional Map:

How to Stay Ahead
Conduct a Needs Analysis to align your real estate strategy with your business objectives.
Secure and Optimize Office Location(s), Space(s), and Lease(s).
Maximize Profitability, Recruitment, and Retention
equest a Needs Analysis
Many companies lose millions of dollars due to lack of employee engagement, loss of top talent, and inefficient or unneeded office space.
Working with Gregg Metcalf, clients gain the insights, the analysis, and the plan to obtain the lease and office space that retains the best employees, attracts top talent, and maximizes productivity as well as profitability.
To Contact Gregg Metcalf:
email: gregg.metcalf@jll.com
mobile: 404.661.9284